Every product on your shelf is money you’ve already spent. Until it sells, that money is stuck.
The inventory turnover ratio tells you how fast it gets unstuck. It counts how many times you sell through your stock in a year. A high number means products sell soon after they arrive. A low number means cash is sitting in boxes.
This guide covers the inventory turnover ratio formula, how to calculate it step by step, a free calculator for Excel and Google Sheets, and benchmarks from real industry data. It also covers the part most guides skip: why a healthy store average can hide products that take years to sell.
What is the inventory turnover ratio?
The inventory turnover ratio is how many times you sell through your average stock in a period, usually a year. You get it by dividing your cost of goods sold by your average inventory, both at cost. A higher number means stock sells faster. A lower number means it sits longer.
Think of it as a speed reading for your shelves. A turnover of 5 means a typical unit takes about 73 days to sell. A turnover of 12 means about a month.
Speed matters because stock on a shelf is cash you can’t use. Every dollar tied up in a slow product is a dollar you can’t spend on the products that sell, on ads, or on a new channel. Turnover shows you how much of your money is working and how much is sitting still.
The inventory turnover formula
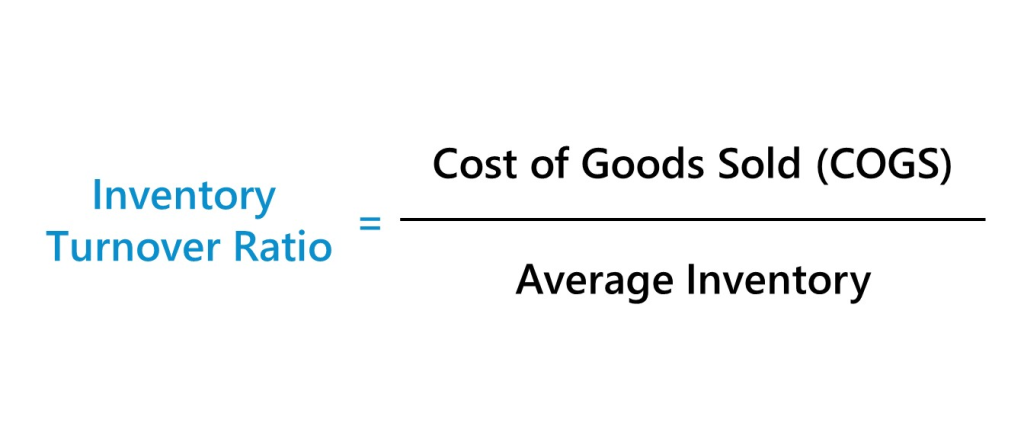
The inventory turnover ratio formula is cost of goods sold divided by average inventory. Average inventory is your stock value at the start of the period plus your stock value at the end, divided by 2. To turn the result into days (also called days sales of inventory, or DSI), divide 365 by your turnover.
These are the standard definitions, as set out by the Corporate Finance Institute and in the accounting reference on inventory turnover.
One rule to get right: use cost on both sides. Cost of goods sold is what you paid for the stock you sold, so your inventory has to be valued at cost too, not at your selling price. Some industry reports divide sales by inventory instead, which gives a higher number. That’s fine for comparing industries, but cost gives the more realistic picture of your own shop.
If you’re measuring a shorter period, swap 365 for the number of days in it: 90 for a quarter, 30 for a month.
For Google Sheets, open a blank sheet and use File > Import. Already selling on two or more channels? Start 14-day trial and sell slow stock on every channel without overselling.
How to calculate inventory turnover
You need three numbers, all at cost: what you paid for the stock you sold, what your stock was worth at the start of the period, and what it was worth at the end. Then you run three simple formulas.
Inventory turnover formulas
Average inventory = (beginning inventory + ending inventory) ÷ 2
Inventory turnover = cost of goods sold ÷ average inventory
Days to sell = 365 ÷ inventory turnover
- Find your cost of goods sold. This is what you paid for the units you sold in the period, not what customers paid you. Your accounting software usually reports it as “cost of goods sold” or “cost of sales.”
- Value your stock at the start. Take the units on hand on the first day and multiply each by its unit cost. Most inventory and accounting tools have a stock valuation report that does this for you.
- Value your stock at the end. Do the same for the last day of the period.
- Work out average inventory. Add the start and end values together and divide by 2.
- Divide cost of goods sold by average inventory. The answer is your inventory turnover ratio: how many times you sold through your average stock.
- Convert it to days. Divide 365 by your turnover. That’s how long a typical unit waits on the shelf before it sells.
Reading the result is simple. A turnover of 6 means you sold through your stock six times in the year, so a typical unit waited about two months. A turnover of 2 means about six months. The lower the number, the longer your money sits.
The inventory turnover ratio calculator does all six steps for you. Type in the three numbers on the Store turnover tab and it fills in the rest. If you already track stock in our free inventory spreadsheet template, you have the unit counts and costs you need.
Only two numbers (start and end) can mislead you if your stock swings a lot, say before and after the holidays. If that’s you, average your stock value at the end of each month instead. It takes longer but gives a truer figure.
What is a good inventory turnover ratio?
A good inventory turnover ratio depends on what you sell. Groceries turn much faster than clothing or specialty goods. Public specialty retailers and apparel companies sell through their stock about 5 times a year on a sales basis, while grocers turn it about 18 times. The best benchmark is your own number, tracked over time.

These figures come from NYU Stern’s industry data (January 2026). The dataset covers nearly 6,000 US public companies, with 15 to 110 in each of these sectors. It lists inventory as a percentage of sales. Divide 1 by that percentage to get turns a year: for grocery, 1 ÷ 0.0549 = 18.2.
| Sector | Inventory as % of sales | Turns a year (sales ÷ inventory) |
|---|---|---|
| Grocery and food retail | 5.49% | 18.2 |
| General retail | 8.67% | 11.5 |
| Household products | 11.55% | 8.7 |
| Specialty retail | 18.76% | 5.3 |
| Apparel | 19.25% | 5.2 |
For a wider view, the US Census Bureau tracks how many months of sales retailers keep in stock. In August 2026, US retailers held about 1.36 months of sales in inventory.
Two things to keep in mind when you compare:
- These are sales-based numbers. They divide sales by inventory, so they run higher than turnover worked out from cost. If your cost-based turnover is a little under the sector figure, you’re probably in a similar place.
- These are big public companies. A small shop with a few hundred SKUs won’t match them exactly. Use them as a rough guide, then compare yourself to last quarter and last year.
Landing near your sector’s number is a good sign. But it only tells you about the store as a whole, and that’s where the real problems hide.
Why your store average hides slow stock
Your store’s turnover is one number for all your products together. That makes it an average, and an average can fool you.
Say a few products sell really fast. They pull the store’s number up, so everything looks fine. But other products might barely sell at all. Some are moving so slowly that, at their current pace, it would take years to sell what’s on the shelf.
The only way to spot them is to check turnover for each product, not just for the whole store.
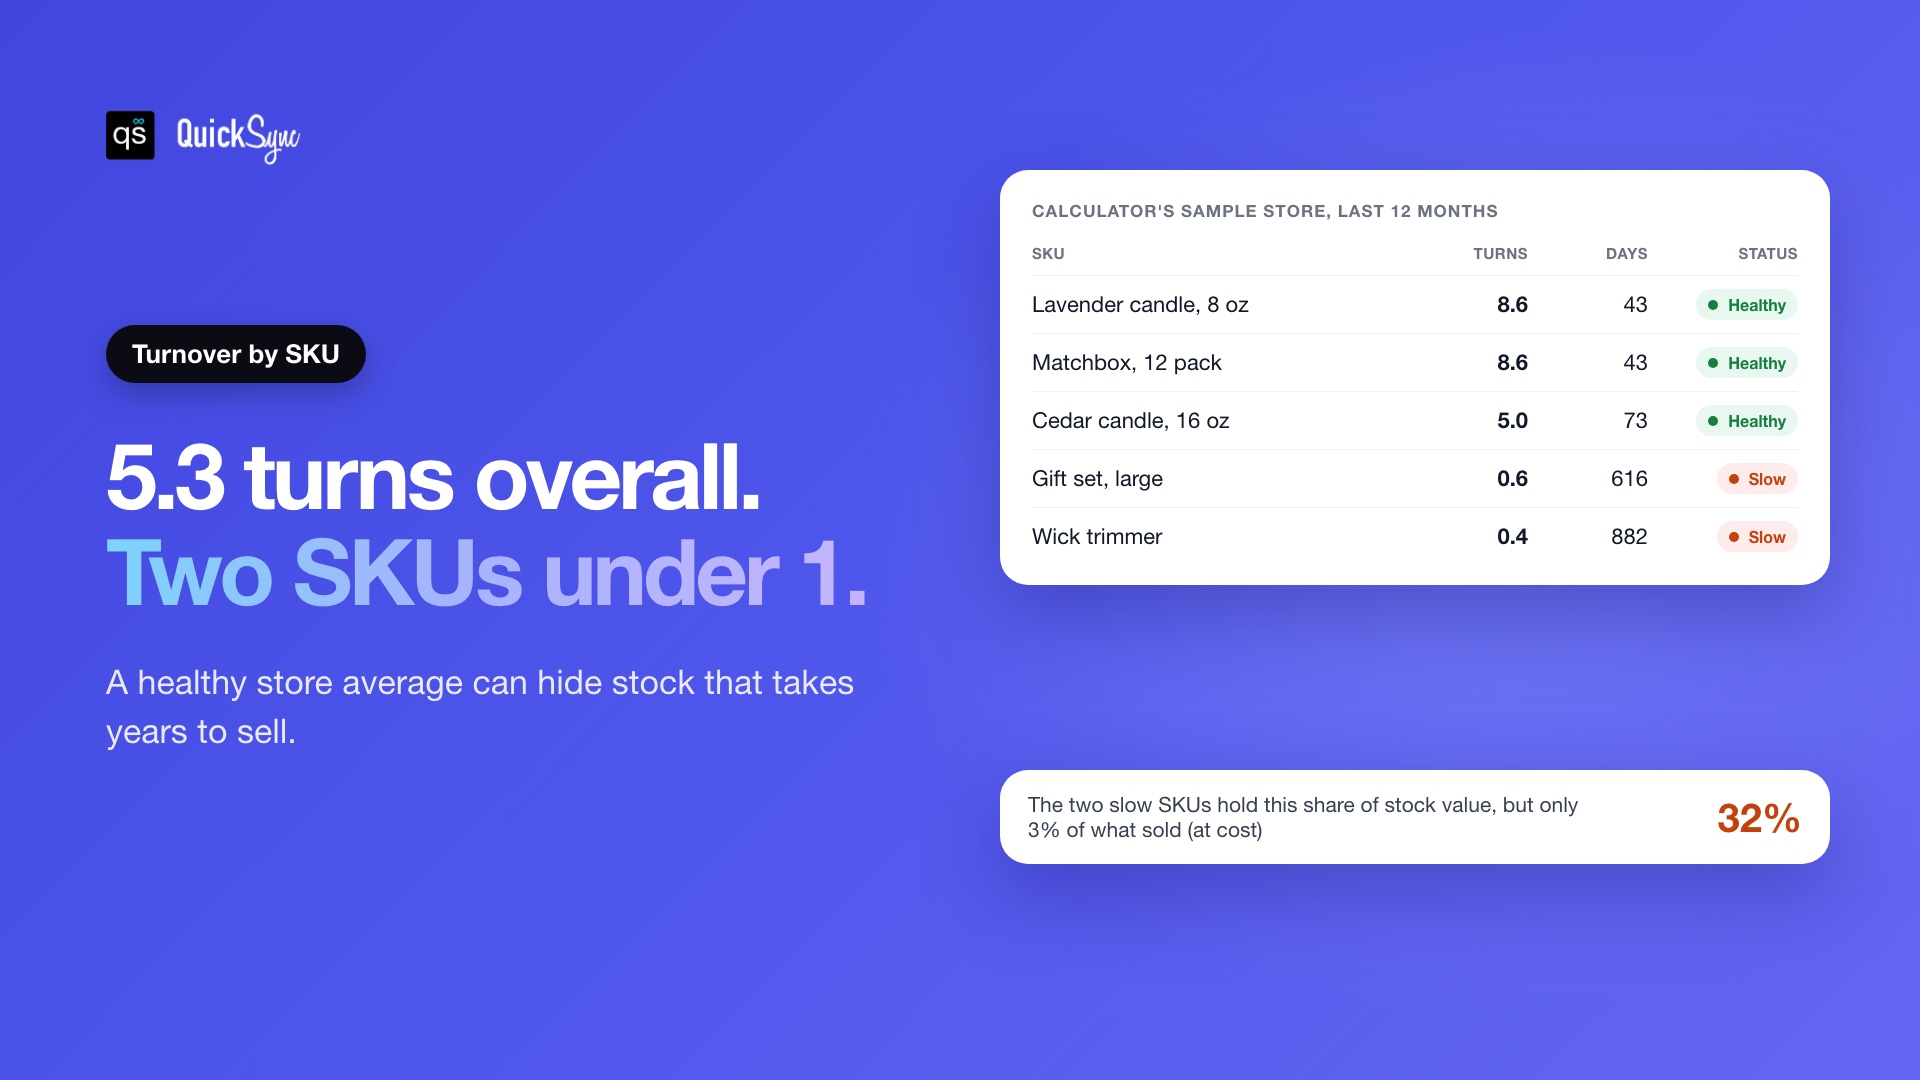
The calculator’s By SKU tab runs the same formula for every product. Here’s what it shows for the sample store that comes in the file, a small shop with eight SKUs and a store-wide turnover of 5.3:
| SKU | Turns a year | Days to sell | Status |
|---|---|---|---|
| Lavender candle, 8 oz | 8.6 | 43 | Healthy |
| Matchbox, 12 pack | 8.6 | 43 | Healthy |
| Cedar candle, 16 oz | 5.0 | 73 | Healthy |
| Gift set, large | 0.6 | 616 | Slow |
| Wick trimmer | 0.4 | 882 | Slow |
The two slow products hold 32% of the store’s average stock value, but account for only 3% of what it sold at cost. That’s nearly a third of the money on the shelf doing almost nothing, in a store whose overall number looks fine.
This is where per-SKU turnover pays for itself. Products that turn less than once a year are at risk of becoming dead stock: inventory that no longer sells at all. The calculator marks anything over 180 days to sell as Slow, and anything with zero sales as Dead stock, so you can see it before it costs more. If you want to rank products by value as well as speed, ABC analysis is a good next step.
How to improve inventory turnover
You improve inventory turnover in two ways: sell the same stock faster, or hold less stock for the same sales. Most of the gains come from fixing the slowest SKUs, not from squeezing the bestsellers.
- Find the slow SKUs first. Run turnover per product, not just per store. In the sample store, two SKUs out of eight drag the whole number down.
- Put slow stock in front of more buyers. A product that only sells at a weekend market, or only on one marketplace, has fewer chances to sell. Selling on more channels at the same time, like Etsy, eBay, TikTok Shop and your own store, gives the same unit more places to find a buyer.
- Bundle or discount what won’t move. A wick trimmer that won’t sell alone can go into a gift set or a “candle care” bundle with a bestseller.
- Reorder smaller, more often. Big orders can lower your unit cost, but they raise your average inventory. Set a reorder point for each SKU and order closer to when you need it.
- Stop rebuying what doesn’t sell. If a SKU turned less than once last year, don’t restock it at the same level.
- Don’t hold separate stock for each channel. Splitting stock between channels means more units on the shelf for the same sales. The next section explains why.
Be careful not to push turnover too high. A very high number can mean you’re running too lean and selling out of your best products. If your turnover jumps while your stockouts rise, you’ve traded slow stock for lost sales. Our guide on how to prevent overselling covers the other side of that balance.
Does selling on more channels improve inventory turnover?
Selling on more channels improves inventory turnover when every channel sells from the same pool of stock. The same units reach more buyers, so you sell more without holding more. If you split your stock between channels instead, your average inventory goes up, and most of the gain disappears.
Here’s why. Turnover is sales divided by average inventory. Adding a channel can raise the top of that fraction. But many sellers protect themselves from overselling by setting aside units for each channel: 10 for Shopify, 10 for Etsy, 10 for eBay. Now they hold 30 units to sell what 10 could cover, and the bottom of the fraction grows too.
Some sellers keep a single pool but update counts manually. That works until two channels sell the last unit on the same afternoon. Then one order gets cancelled, and marketplaces like eBay and Amazon count seller cancellations against your account.
The fix is one shared count that updates on every channel when anything sells. Each unit can then be listed everywhere at once, without the buffer stock and without the risk of selling it twice.
How inventory sync tool helps you turn stock faster
Inventory sync tool like QuickSync is for sellers who sell in more than one place. It connects your shops and keeps one stock count across all of them.
- One count across every channel. Connect Shopify, Etsy, eBay, Amazon, TikTok Shop and your POS. When a unit sells anywhere, QuickSync updates the count on every other channel, usually within a couple of minutes.
- No buffer stock. Because every channel sees the same number, you don’t need to set aside units for each one. That keeps your average inventory down and your turnover up.
- No overselling. When the last unit sells, it shows as sold out everywhere, so you don’t cancel orders or put marketplace standing at risk.
- More places for slow stock to sell. From the Pro plan, QuickSync can also create the listing on each new channel from a single product, so a slow SKU on one channel can reach buyers on another.
Real-time inventory syncing won’t fix a product nobody wants. But for stock that’s simply in the wrong place, it’s often the quickest way to get it moving.