Most small shops start tracking stock the same way: a spreadsheet with product names down one side and numbers down the other. It works for a while. Then a sale on one channel doesn’t make it into the sheet, and you sell something you don’t have.
That gap is expensive at scale. IHL Group estimates that out-of-stocks and overstocks cost retailers about $1.7 trillion a year worldwide.
We built this inventory spreadsheet template to make the manual approach as reliable as it can be. It has five tabs, real formulas and a dropdown on every field where a typo would break the math. It works as an Excel inventory template and as a Google Sheets inventory template, with the same formulas in both.
The whole guide follows one example: a small candle shop that sells on Shopify, on Etsy and at a Saturday market through Square POS. The sample data in the template is that shop’s data, so what you read here matches what you’ll see when you open the file.
Here’s what’s inside, how to set it up, and when a spreadsheet stops being enough.
What’s inside the free inventory template
The template has five tabs. You type in three of them and read the other two.
| Tab | What you do there | What it does for you |
|---|---|---|
| Start here | Read once | Setup steps and a colour key |
| Dashboard | Nothing | Shows SKUs, units on hand, stock value, items to reorder and units sold by channel |
| Products | Add one row per SKU | Calculates stock in, stock out, on hand, status, stock value and margin |
| Stock moves | Log every change | Feeds every number on the Products tab |
| Channel check | Type what each channel shows, weekly | Flags any channel whose count doesn’t match your sheet |
Blue text means you type it. Shaded cells hold formulas, so leave them alone. That one rule prevents most spreadsheet mistakes, and there are a lot of them to prevent.
The biggest design choice is the Stock moves tab. You never overwrite a stock number. You log what happened instead: 9 sold on Etsy, 24 received from the supplier, 1 returned. The sheet adds it all up. If a number looks wrong later, you can scroll back and see exactly why.
What should an inventory spreadsheet include?
An inventory spreadsheet should include a unique SKU, product name, unit cost, opening stock, stock in, stock out, stock on hand and a reorder point for every item. Add a status column that flags low stock, and a log of every stock change with its date and sales channel. That log is what makes the numbers trustworthy.
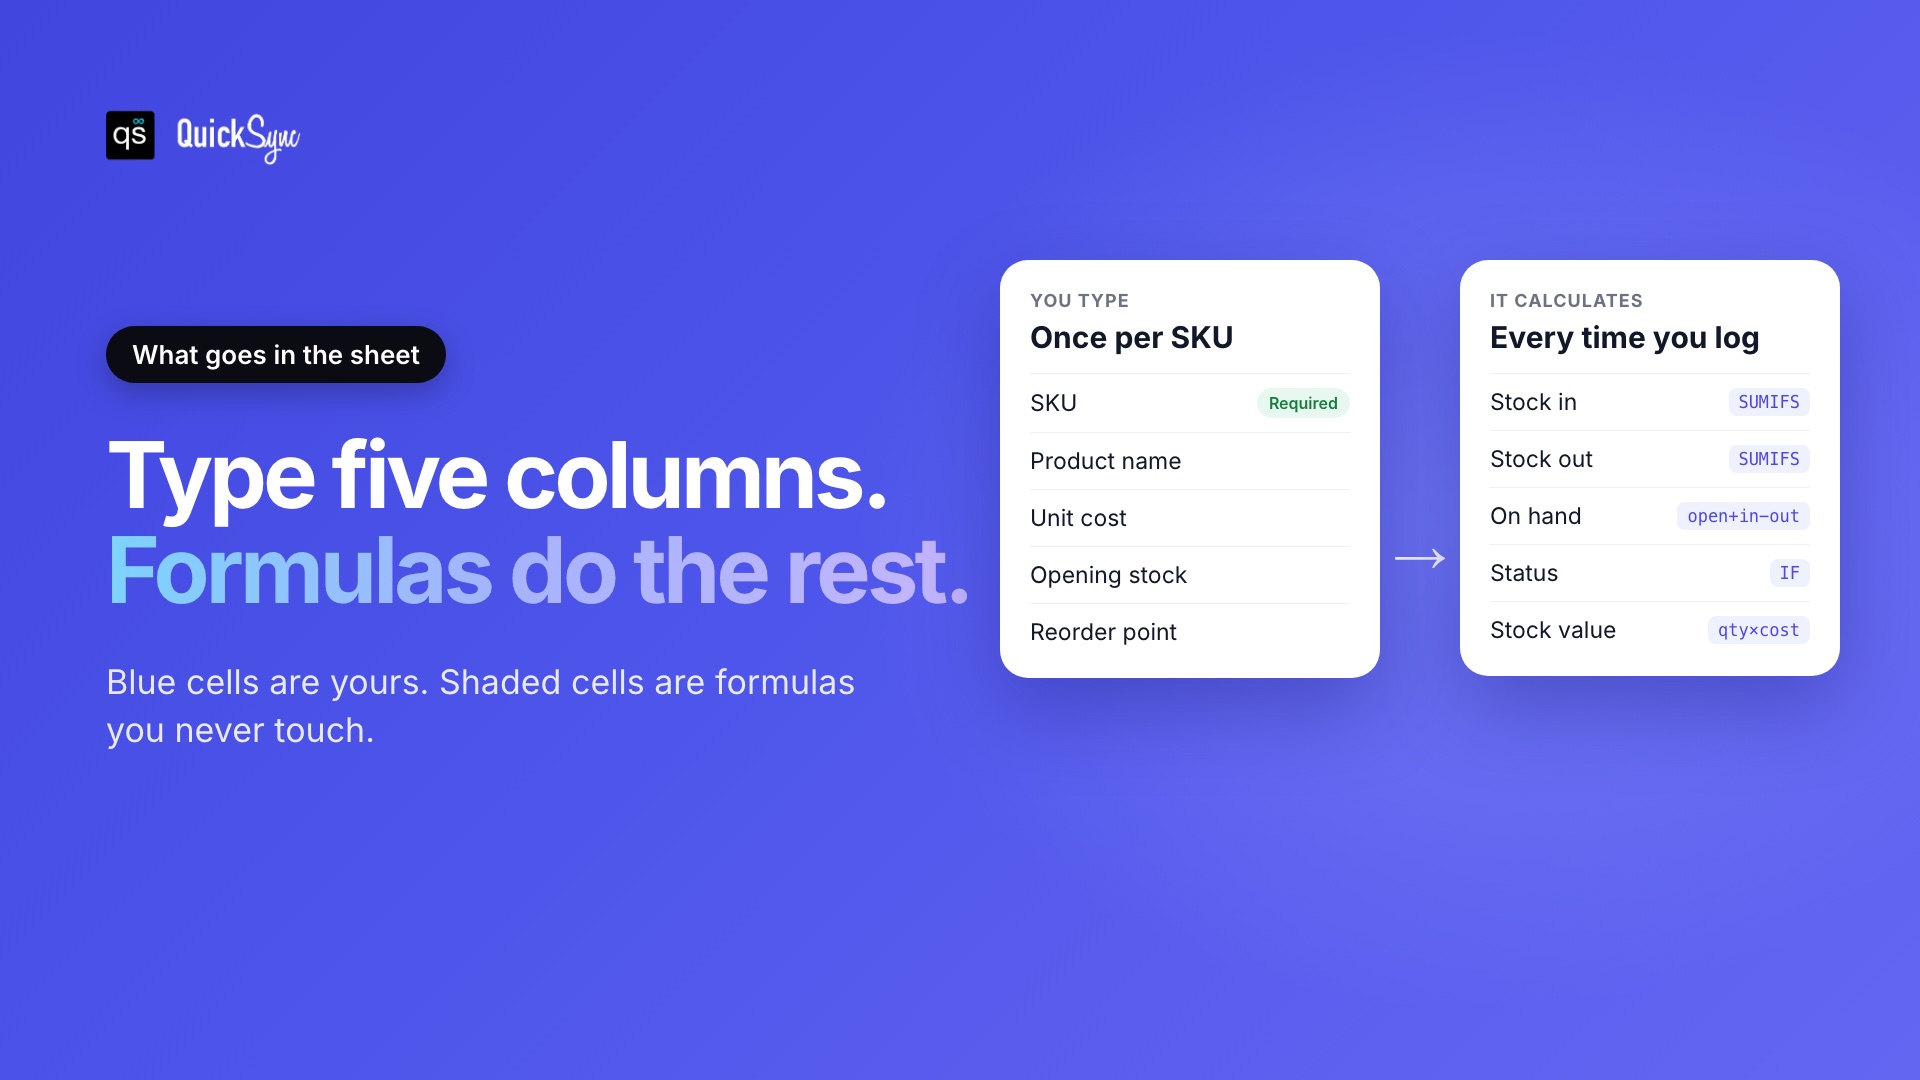
Here’s how the template splits the work:
| Column | You type it? | How it works |
|---|---|---|
| SKU | Yes | A unique code per variant, like CND-LAV-8OZ. See our SKU naming rules. |
| Product name, variant, category, supplier | Yes | Plain text for sorting and filtering |
| Unit cost, sale price | Yes | Used for stock value and margin |
| Opening stock | Yes, once | What’s on the shelf on day one |
| Reorder point, reorder qty | Yes | When to order and how many |
| Stock in | No | Sum of Received, Returned and positive Adjustments |
| Stock out | No | Sum of Sold and negative Adjustments |
| On hand | No | Opening stock + stock in − stock out |
| Status | No | OK, Reorder or Out of stock |
| Stock value, margin % | No | On hand × unit cost, and (price − cost) ÷ price |
The SKU is the column that matters most. Every formula looks items up by SKU, so two products sharing a code will merge their stock counts. Keep one SKU per variant: the 8 oz and 16 oz lavender candles are two rows, not one.
How to set up the template in 10 minutes

You don’t need to know formulas to use this. Here’s the order that works best.
- Open the file. For the Excel inventory template, just open the .xlsx. For Google Sheets, open a blank sheet and import the .xlsx with File > Import, then pick “Create new spreadsheet”. Formulas and dropdowns carry over.
- Delete the sample rows. Clear the candle shop data on the Products and Stock moves tabs. Don’t delete the shaded formula columns.
- Add your products. One row per SKU on the Products tab. If you already sell online, export your list instead of typing it. Shopify lets you export inventory as a CSV from Products > Inventory, and Etsy lets you download your listing data with SKU and quantity included. Paste the SKU, title and quantity columns in. Our Etsy inventory management guide shows a weekly routine for Etsy.
- Count your opening stock. Do a real shelf count and type it in the Opening stock column. This is the only time you’ll edit that number.
- Set reorder points. Use the formula in the next section. A rough number today beats a perfect one next month.
- Start logging. Every sale, delivery, return and correction gets one row on Stock moves. Pick the SKU, type and channel from the dropdowns.
In the candle shop’s first nine days, the 8 oz lavender candle started at 40. They logged 29 sold across Shopify, Etsy and two Saturday markets, 24 received from their supplier, and 1 return. The sheet shows 36 on hand without anyone doing the math.
How to calculate a reorder point
A reorder point is the stock level that tells you to place a new order. To work it out, multiply your average daily sales by your supplier’s lead time in days. Then add safety stock to cover slow deliveries or a busy week. When on hand drops to that number, reorder.
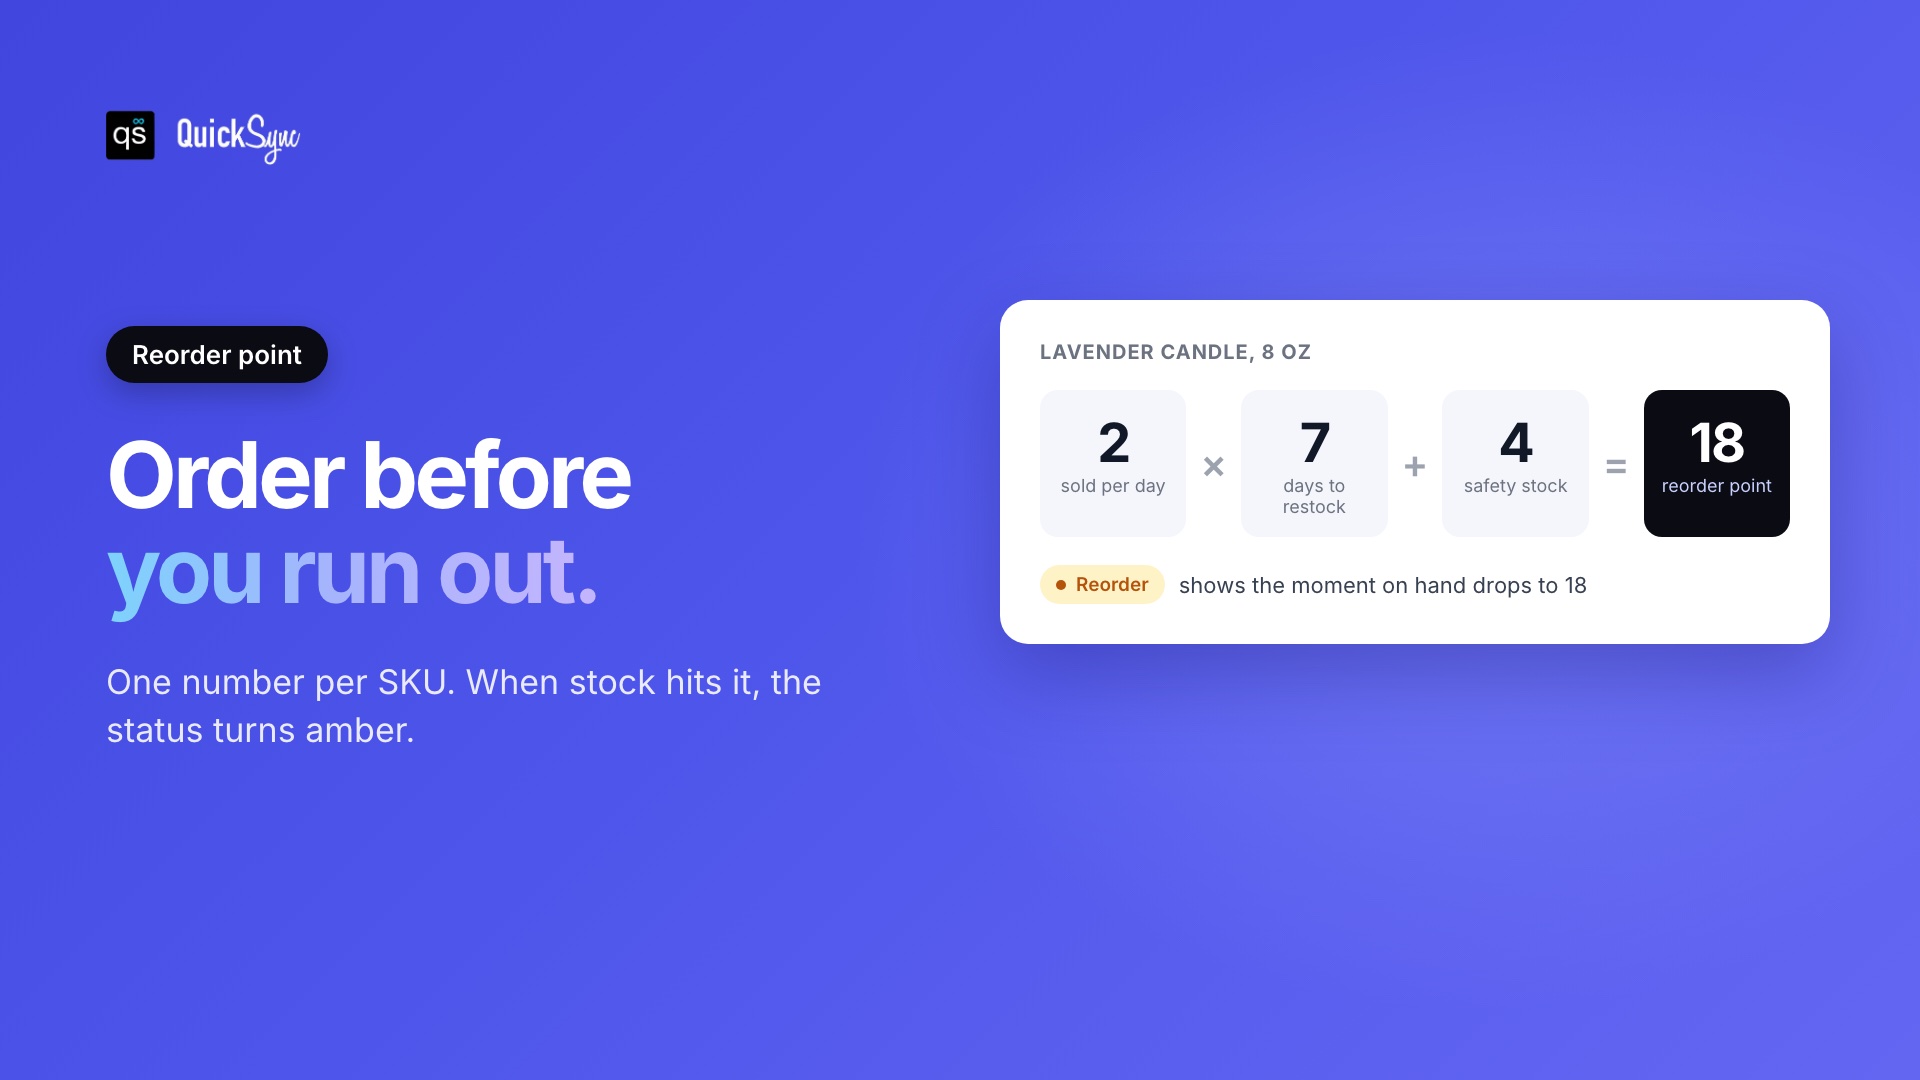
Here it is with the lavender candle:
Reorder point = (average daily sales × lead time in days) + safety stock
              = (2 × 7) + 4
              = 18
In a normal month, the shop sells about 2 a day. (Those first nine days were busier, which is exactly why you shouldn’t plan from a launch week.) WaxWorks takes 7 days to deliver. They keep 4 extra in case a delivery slips. So when the count hits 18, the Status column turns amber and says Reorder.
A few practical notes:
- Use last month’s sales, not your best week. Divide units sold by 30 for a daily average.
- Pad the lead time if your supplier is unreliable. Safety stock is cheaper than a stockout.
- Revisit it every quarter. A product that starts selling faster needs a higher reorder point, or you’ll run out between orders.
How to make an inventory list in Google Sheets from scratch
If you’d rather build your own sheet, you need three things: a product list, a log of stock changes, and formulas that connect the two. SUMIFS adds up the log for each SKU, a dropdown keeps the entries consistent, and conditional formatting colours the rows that need attention.
These are the formulas the template uses, so you can copy them into any sheet. They work the same in Excel and Google Sheets.
Stock in (sums every positive change for this SKU on the Stock moves tab):
=SUMIFS('Stock moves'!G:G, 'Stock moves'!B:B, A2, 'Stock moves'!G:G, ">0")On hand:
=H2 + I2 - J2Status:
=IF(K2<=0, "Out of stock", IF(K2<=L2, "Reorder", "OK"))Microsoft’s SUMIFS reference explains the syntax if you want to add more conditions, like sales on one channel only.
Then add two guardrails. First, a dropdown list on the SKU, Type and Channel columns, so nobody types “etsy ” with a trailing space and breaks a total. Second, conditional formatting on the Status column: green for OK, amber for Reorder, red for Out of stock. In Excel, it’s the same feature under Home > Conditional Formatting.
That’s a working system. Building it takes an afternoon, which is why we made the template.
Where an inventory spreadsheet breaks
A spreadsheet only knows what you type into it. That’s fine when you sell in one place. It turns into a problem when the same stock is listed on two or three channels, because each one keeps its own count, and none of them reads your sheet.
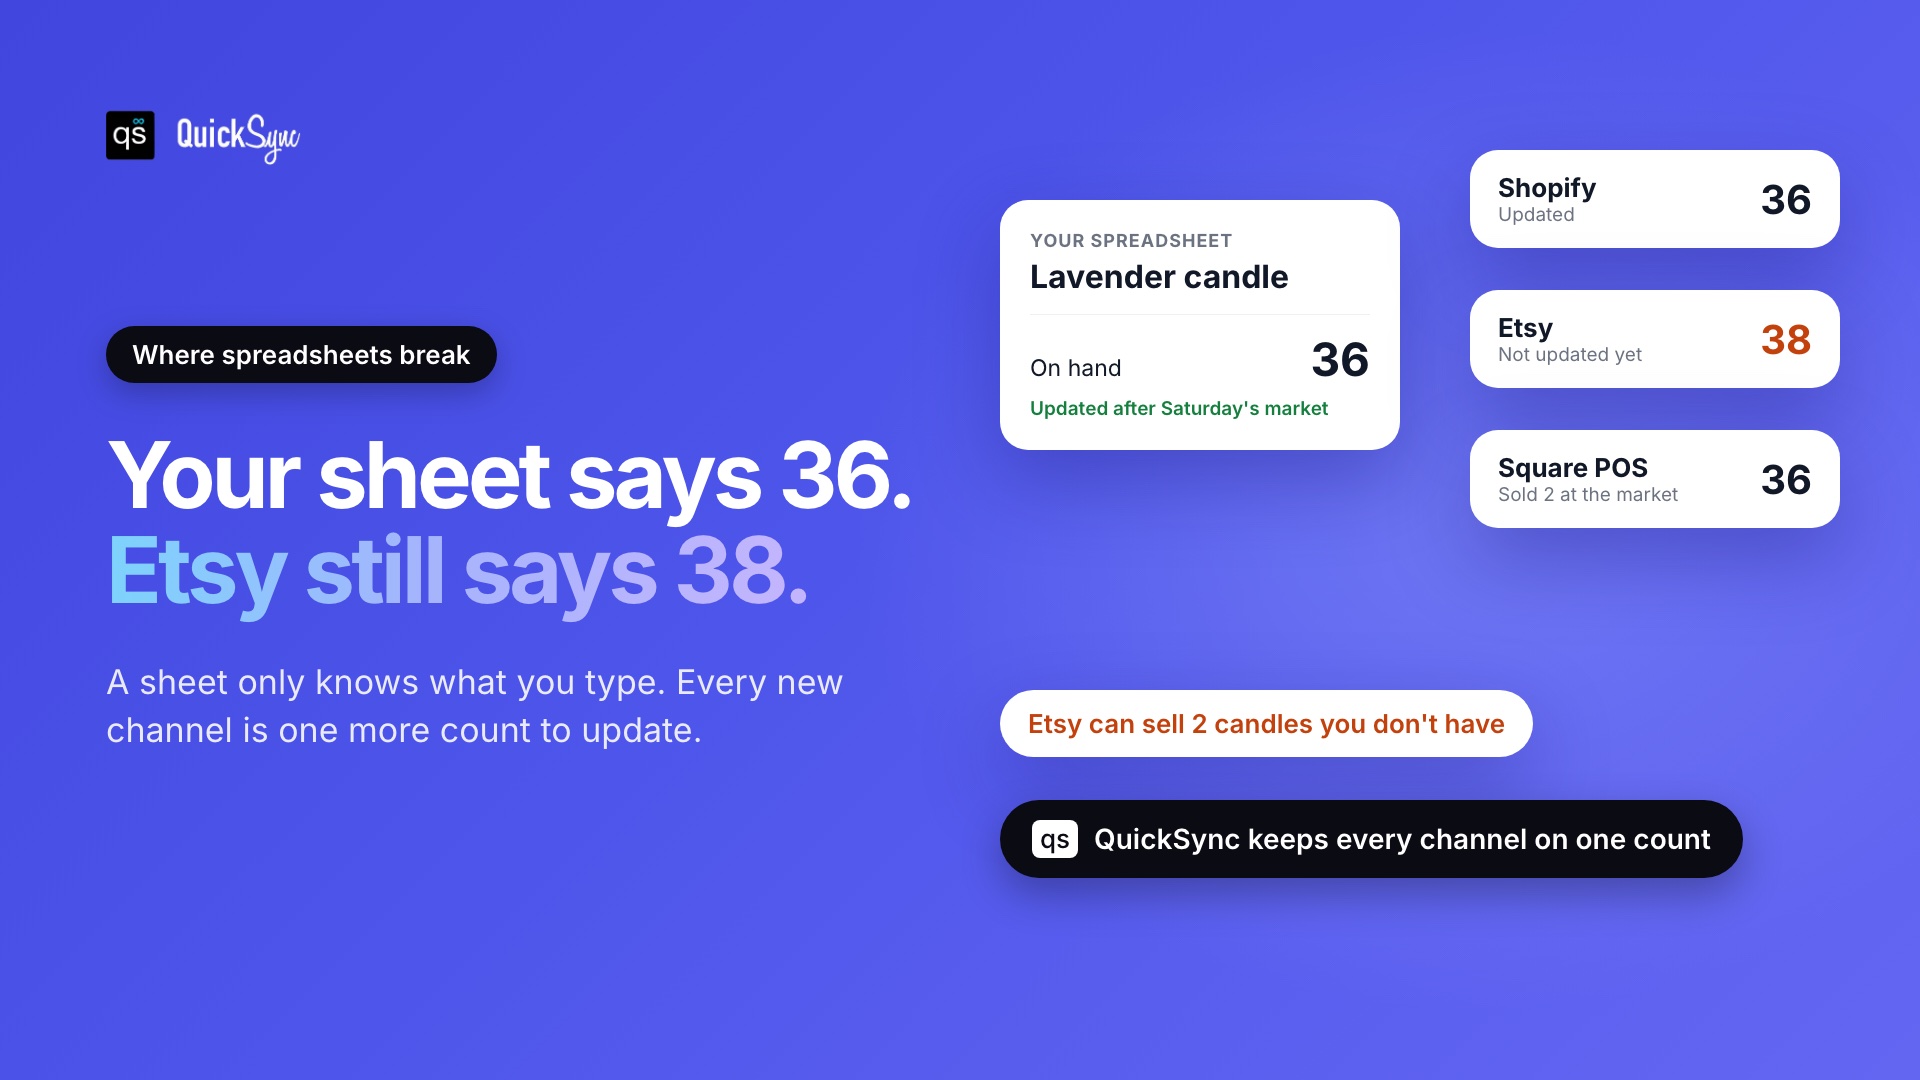
Here’s what that looked like for the candle shop. At their second Saturday market, they sold the last 2 lavender candles of the day through Square. Square’s count dropped right away. They updated the sheet on Sunday night and changed Shopify to match. They forgot Etsy.
So on Monday morning, the sheet says 36, Shopify says 36, and Etsy says 38. Etsy can now sell 2 candles that don’t exist. When that order comes in, the shop has to cancel it, refund the buyer, and hope the review isn’t too harsh.
That’s why the template has a Channel check tab. Once a week, type what each channel shows next to what your sheet says. Any mismatch turns red, and the Dashboard counts how many SKUs are off. It won’t stop drift (channel counts slowly moving apart between updates), but it catches it before a customer does. If it’s flagging the same products every week, our guide on how to prevent overselling covers the fixes in more depth, and inventory reconciliation walks through a full count.
Let’s be honest though: a weekly check means up to six days of drift. With three channels and 80 SKUs, that’s a lot of chances to oversell.
When to move from a spreadsheet to inventory sync
Stay with a spreadsheet while you sell on one channel, have fewer than about 100 SKUs and update it yourself. Move to automatic inventory sync once the same stock sells on two or more channels, your POS and online counts stop matching, or you’ve had to cancel an order because of a wrong count.
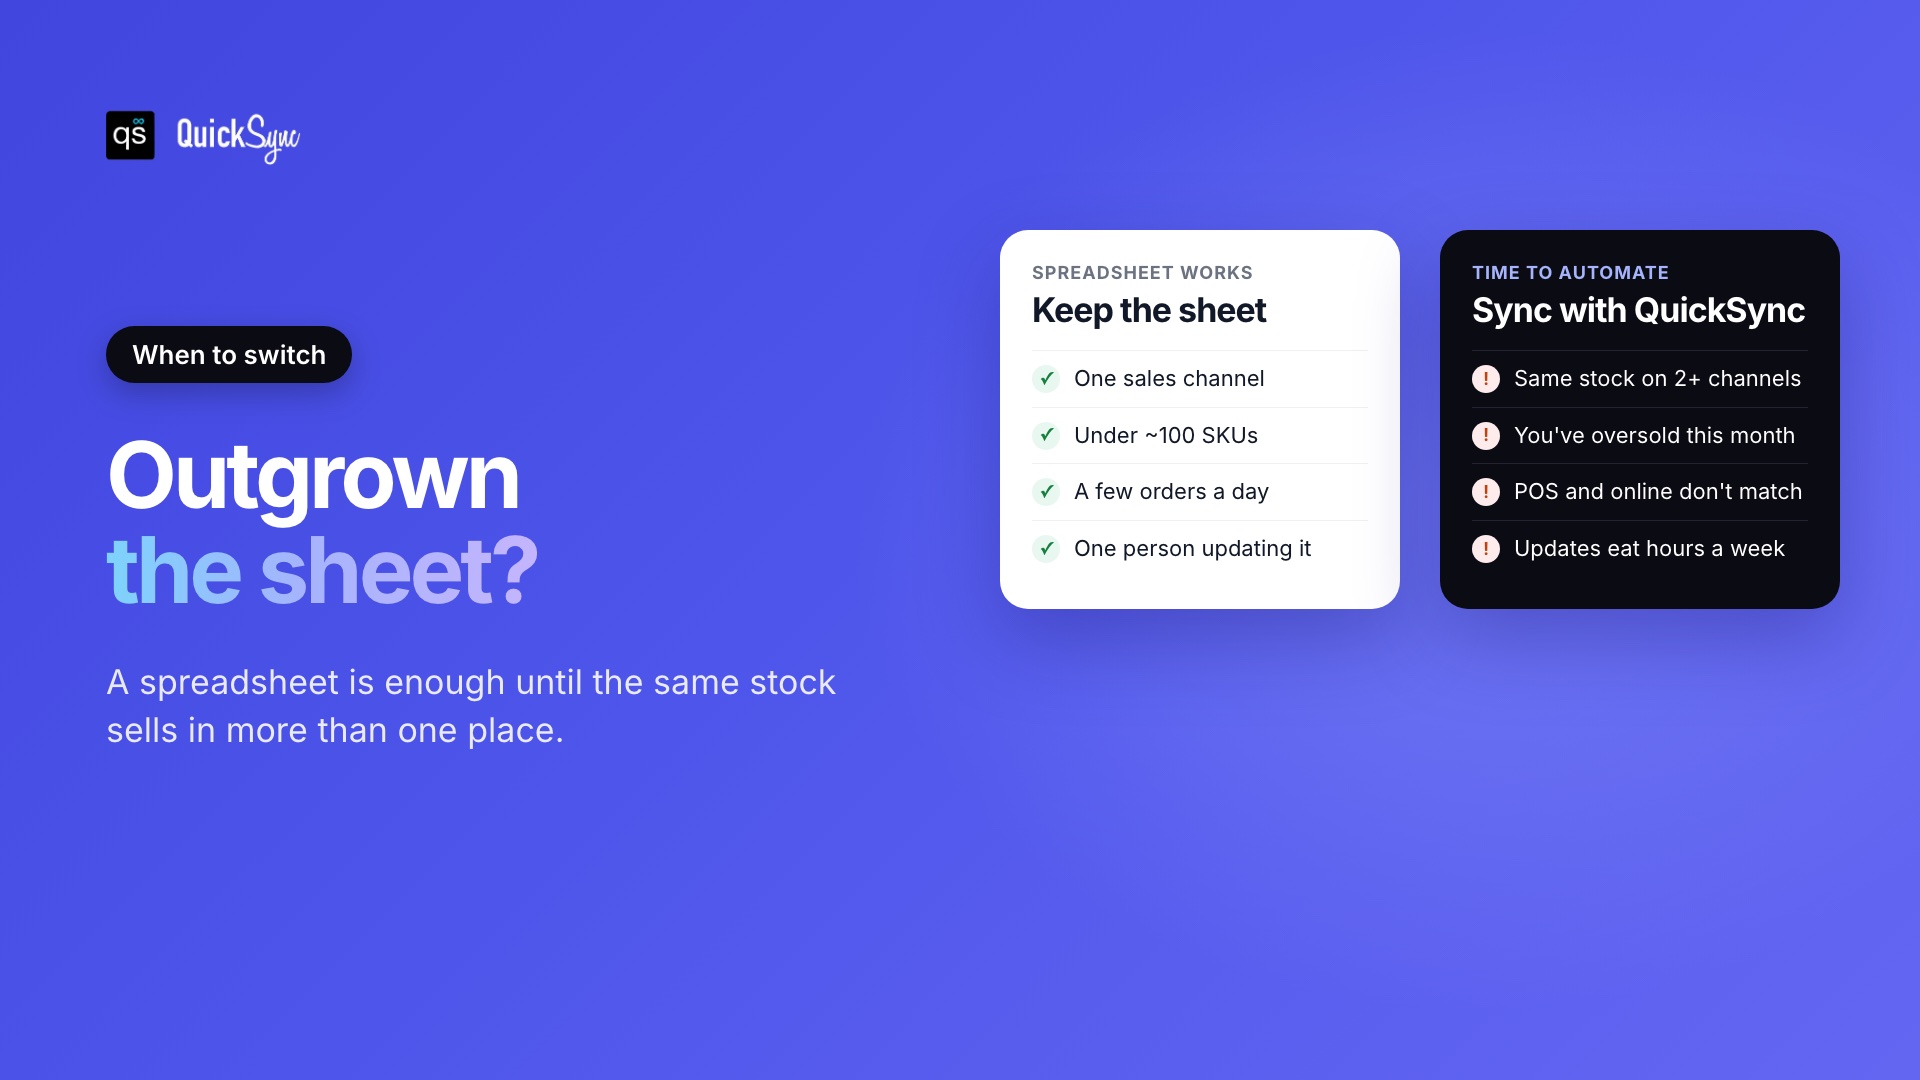
The signs are usually obvious in hindsight:
- You’ve oversold at least once this month. One cancelled order is a warning. Two is a pattern.
- Your Channel check tab is always red. That’s the sheet telling you it can’t keep up.
- You run a POS and an online store. In-store sales through Square or Clover happen too fast to log by hand.
- Updating counts takes hours every week. That time has a cost, even if it doesn’t show up on an invoice.
At that point, the fix isn’t a better spreadsheet. It’s taking the typing out of the loop. With real-time inventory syncing, a sale on any channel lowers the count everywhere else, usually within a couple of minutes. For the candle shop, that meant connecting Shopify, Etsy and Square once, then never updating Etsy by hand again. If that’s your setup too, here’s how to sync Shopify and Etsy.
You can keep using the spreadsheet for what it’s good at: reorder planning, cost tracking and the occasional stocktake.
Your spreadsheet can’t see the next sale
A good inventory spreadsheet template does three jobs. It keeps one row per SKU, logs every stock change instead of overwriting numbers, and tells you when to reorder. This free template does all three in Excel and Google Sheets, with formulas already built in.
But be honest about one thing: how many times this week did you type the same stock number into two places? Every one of those is a gap where a channel shows stock you no longer have. And an oversell costs more than the sale. You refund the buyer, a cancellation lands on your seller record, and that customer rarely comes back.
A spreadsheet can’t close that gap, because it doesn’t know a sale happened until you type it in. QuickSync does. Connect your channels once, and every sale lowers stock everywhere else, usually within a couple of minutes. It matches products by SKU, so the codes you set up in this template carry straight over.
Try it on your own products before you pay anything. Start 14-day trial: no card, and every trial includes a free 30-minute session where the team connects your first two shops with you. Plans start at $19 a month for two shops.
Your spreadsheet got you this far. Don’t let it be the reason you oversell next.